
Page 23 - Fall 2017 Magazine
P. 23
annual rePort: fisCal year 2016-2017
fiscal year ending june 30, 2017
STATEMENT OF ACTIVITY
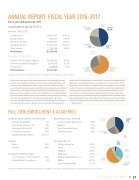
income 2016-2017
Contributions* $2,897,737
Other Income 1.5%
Contributions 46.6%
Special Events Net Tuition & Fees Auxillary Services Other Income Total Income
expenses 2016-2017
Instruction & Academic Support
General & Institutional Support
Fundraising $296,178 Total Expenses $5,771,587
46.63% 0.65% 31.04% 20.20% 1.48%
68.1% 26.7% 5.1%
Auxillary Services 20.2%
Net Tuition & Fees 31%
Fundraising 5.1%
$40,105 $1,928,780 $1,255,582 $92,194 $6,214,398
Special Events .65%
$3,932,668 $1,542,741
General & Institutional Support
Instruction & Academic Support
26.7%
68.1%
*includes $850,000 outstanding health science Pledge, net Contribution income is 38.2%.
Friends, as you review our most recent summary annual report, I’d like to highlight a few items. providence is blessed with the abundant counsel of a devoted and active Board of trustees that continues to exercise prudent nancial controls as they seek to be wise stewards of the gifts you’ve entrusted to them and our executive leadership. the income summary may seem distorted because of the $1.1 million Health science gift, of which $850k is pledged for payment over the next four years. We are required to report it as income. taking this into account and subtracting it from the contribution (donation income), our net contribution income for the scal year is actually 39% of the total operating budget. this should be very encouraging news for all. It demon- strates that the college is continuing to move in the right direction nancially. this is the second consecutive year that our reliance on donation income as a percentage of the total operating
budget is below 50% and decreasing. Last year was 44.5%, the rst year we dropped below 50%. additionally, our overall fundraising expenses moved down from 6.2% last year to 5.1% of total expenditures. It was a dif cult year for enrollment, growing only by a modest 2%. there are many reasons for this and we are actively making improvements to regain the high enrollment growth we have enjoyed in the past three years, which has more than tripled our enrollment. In some sense, a plateau is to be expected following a signi cant growth cycle. We are prepared and ex- pect the next growth cycle in enrollment this year, especially with the launch of the Health science program. We are grateful for your continued investment in providence, and we value your nancial support for this coming current scal year and your prayers for enrollment and academic progress.
– Michael Kiledjian
fall 2016 enrollment & aCademiCs
GENERAL ENROLLMENT INFORMATION
Total Student Body 167 Percentage Gain (vs. ’15) 2% Residential Students 90% Commuter Students 10% Student/Faculty Ratio 13.3 to 1
GENDER
Male 53% Female 47%
GEOGRAPHIC BREAKDOWN
U.S. (19 States, 65% from CA) 94% International (4 countries) 6%
DENOMINATIONAL PROFILE
Confessionally Reformed Baptist Non-Denominational Christian Other
RACE/ETHNICITY
Christian-Other 33%
Non-Denominational 20%
Non-Resident Alien 6.6%
White 54.5%
Confessionally Reformed
41% 6% 20% 33%
41%
African American
Asian 1.2% Hispanic 28.1% Multiracial 4.8% Native Hawaiian/Pac. Isl. 0.6% White 54.5% Non-Resident Alien 6.7%
4.2%
4.2%
African American
Baptist 6%
Asian 1.2%
Hispanic 28.1%
Multiracial 4.8%
Native Hawaiian Pacific Islander
Complete enrollment and academic information is available on our website: www.providencecc.edu/about-providence/at-a-glance
Deeper Learning for Greater Wisdom
23
0.6%
